TL;DR:
- Mean, median, and mode are three measures of central tendency that describe different aspects of data distribution.
- The dataset’s mean is approximately 14.11, the median is 14, and the mode is 14, indicating a fairly symmetric distribution.
Mean, median, and mode are three measures of central tendency: the mean is the arithmetic average (sum divided by count), the median is the middle value when data is ordered, and the mode is the most frequent value. For the dataset 13, 16, 12, 14, 19, 12, 14, 13, 14, the results are:
- Mean: (13 + 16 + 12 + 14 + 19 + 12 + 14 + 13 + 14) ÷ 9 = 127 ÷ 9
- Median: Ordered list is 12, 12, 13, 13, 14, 14, 14, 16, 19 — the middle value is 14
- Mode: 14 appears three times — more than any other value — so the mode = 14
For this dataset, all three measures land at or near 14, which tells you the data is fairly symmetric with no dramatic outliers pulling the mean away. The mode is the most intuitive "typical" value here because it is the most common score and matches the median exactly.
Table of Contents
- What do mean, median, and mode each measure?
- How to calculate the mean step by step
- How to calculate the median for odd and even counts
- How to find the mode, including multimodal cases
- When should you use mean vs. median vs. mode?
- Common mistakes to avoid when calculating these measures
- Practice problems and the Apexa Pro calculator
- Key Takeaways
- Why reporting all three measures matters
- Try the Apexa Pro free calculator now
- Useful sources for further reading
What do mean, median, and mode each measure?
These three measures each capture a different idea of "typical." Knowing which one to reach for depends on your data type and whether outliers are present.
- Mean (arithmetic average): Add all values, divide by the count. The mean is sensitive to outliers — one extreme value can pull it far from the center of the rest of your data.
- Median (middle value): Sort the data, pick the middle. The median resists extreme values because it is position-based, not calculation-based. Use it when your data is skewed or contains outliers.
- Mode (most frequent value): Count occurrences, find the highest frequency. The mode is the only measure that works for nominal (categorical) data/02%3A_Exploring_and_Summarizing_Data/2.01%3A_Measures_of_Central_Tendency-_Mean_Median_and_Mode) — like favorite colors or shirt sizes — where mean and median are meaningless.
| Measure | Best situation |
|---|---|
| Mean | Symmetric numeric data, no extreme outliers |
| Median | Skewed numeric data or datasets with outliers |
| Mode | Categorical data, or finding the most common value |
How to calculate the mean step by step
The arithmetic mean formula is:
x̄ = Σx / n

Here, x̄ is the mean, Σx is the sum of all values, and n is the count of values.
For the dataset 13, 16, 12, 14, 19, 12, 14, 13, 14, here is the full calculation:
- Add all values: 13 + 16 + 12 + 14 + 19 + 12 + 14 + 13 + 14 = 127
- Count the values: There are 9 numbers in the set.
- Divide: 127 ÷ 9
The mean of 14.11 tells you that if you redistributed the total equally across all nine values, each one would be approximately 14.1. It is a useful summary when every data point deserves equal weight in the result.
One thing to watch: if you added a tenth value of, say, 95, the mean would jump to about 22.4 — far above most of the original values. That sensitivity is exactly why the median often tells a more honest story.
How to calculate the median for odd and even counts
Sorting your data before finding the median is non-negotiable. The median of an unsorted list is meaningless.
- Sort the data in ascending order.
- Odd count (n is odd): The median is the single middle value at position (n + 1) / 2.
- Even count (n is even): Average the two middle values at positions n/2 and (n/2) + 1.
- Report the result as a single number, even when it falls between two data points.
Odd count example (our dataset, n = 9): Sorted: 12, 12, 13, 13, 14, 14, 14, 16, 19 Position (9 + 1) / 2 = 5th value → Median = 14
Even count example (n = 6): Dataset: 3, 7, 8, 12, 15, 20 Two middle values (positions 3 and 4): 8 and 12 Median = (8 + 12) / 2 = 10
Notice that 10 does not appear in the original dataset — that is perfectly fine. The median is a positional summary, not a requirement to match an actual data point.
How to find the mode, including multimodal cases
Finding the mode starts with a frequency count: tally how many times each value appears, then identify the highest frequency.

For the dataset 13, 16, 12, 14, 19, 12, 14, 13, 14:
| Value | Frequency |
|---|---|
| 12 | 2 |
| 13 | 2 |
| 14 | 3 |
| 16 | 1 |
| 19 | 1 |
14 appears three times — more than any other value — so the mode is 14. This dataset is unimodal (one mode).
- Unimodal: One value appears most often (e.g., mode = 14 above).
- Bimodal: Two values tie for highest frequency (e.g., in {2, 4, 4, 6, 6, 8}, both 4 and 6 are modes).
- Multimodal: Three or more values share the top frequency.
- No mode: Every value appears exactly once — no single value stands out.
The mode shines brightest with categorical data. If you survey 50 students about their favorite subject and "Math" gets chosen 22 times, that is your mode — and it is the only central tendency measure that makes sense for that question. Applying mean or median to category labels is not possible.
When should you use mean vs. median vs. mode?
The right measure depends on your data's shape and what you are trying to communicate. In symmetric distributions, the mean, median, and mode coincide/02%3A_Exploring_and_Summarizing_Data/2.01%3A_Measures_of_Central_Tendency-_Mean_Median_and_Mode); as skewness increases, they diverge and the mean moves toward the long tail.
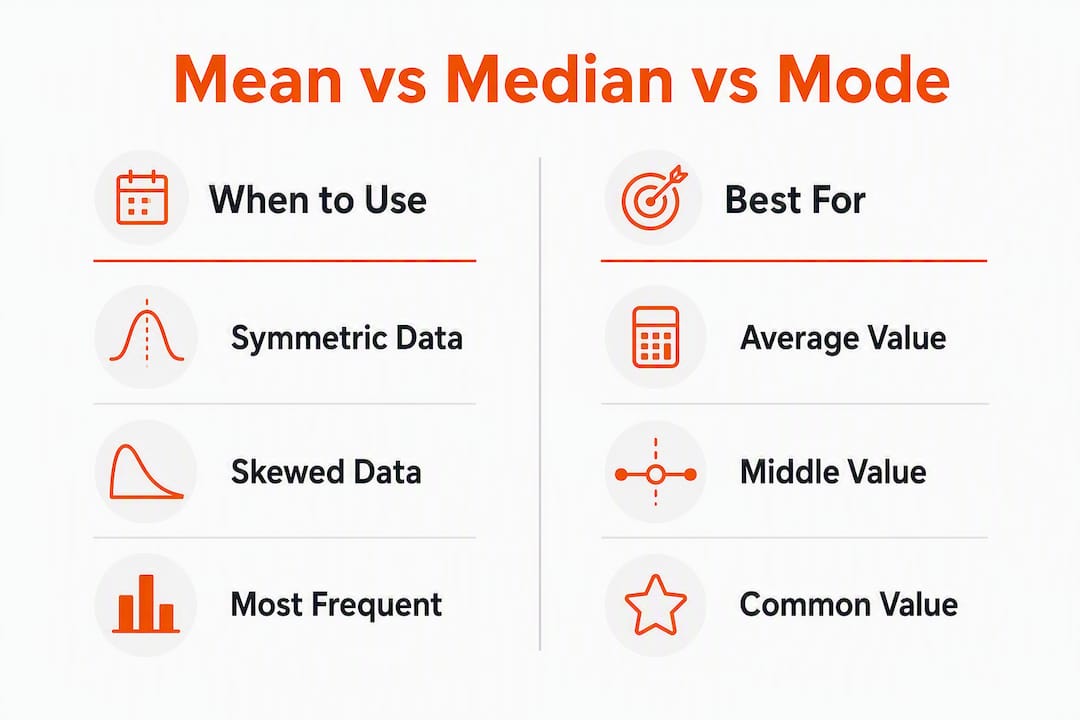
A practical example: newspapers and researchers consistently prefer the median for household income because a small number of very high earners pull the mean well above what most households actually earn. The median gives the truer picture.
Start with a histogram or box plot to judge symmetry and spot outliers before committing to a measure.
| Data type / situation | Best measure |
|---|---|
| Symmetric numeric (no outliers) | Mean |
| Skewed numeric or outliers present | Median |
| Categorical / nominal | Mode |
| Ordinal (ranked, e.g., survey scales) | Median |
| Finding most popular item or score | Mode |
You can also use the relationship between mean and median as a quick skew diagnostic. If the mean is greater than the median, the data is typically right-skewed; if the mean is less than the median, it is typically left-skewed. For our dataset, the mean and median values are very close, confirming the data is close to symmetric.
Common mistakes to avoid when calculating these measures
- Forgetting to sort for the median. Picking the middle value from an unsorted list gives a wrong answer every time.
- Miscounting n. Always count your data points explicitly. Off-by-one errors in n change both the mean and the median position.
- Calling the mode an "average" for continuous data. When every value in a dataset is unique, there is no mode — do not force one.
- Rounding too early. Round only the final answer, not intermediate sums. Rounding 127 ÷ 9 at each step compounds error.
- Reporting "average" without naming which one. Statistics experts advise always specifying mean, median, or mode to avoid miscommunication — "average salary" and "median salary" can differ by tens of thousands of dollars.
Pro Tip: Compare your mean and median before reporting. If they are close, your data is roughly symmetric and the mean is reliable. If they diverge noticeably, outliers or skew are likely present — switch to the median and investigate the extremes.
Practice problems and the Apexa Pro calculator
The Apexa Pro mean/median/mode calculator runs free in your browser with no sign-up. Enter your dataset, and it returns the mean, median, and mode instantly — useful for checking hand calculations before submitting homework or a report.
How to use it:
- Open the calculator at apexapro.com.
- Type or paste your numbers, separated by commas.
- Hit calculate and compare the output against your hand-worked answer.
- If results differ, recheck your sum (mean), your sorted order (median), or your frequency tally (mode).
Practice problems:
-
Simple: Dataset: 5, 8, 3, 7, 8, 6, 8 Mean = 45 ÷ 7 ≈ 6.43; Median (sorted: 3,5,6,7,8,8,8) = 7; Mode = 8
-
With an outlier: Dataset: 10, 12, 11, 13, 10, 75 Mean = 131 ÷ 6 ≈ 21.8; Median = (11 + 12) / 2 = 11.5; Mode = 10. Notice how the outlier (75) inflates the mean far above the median.
-
Categorical/multimodal: Favorite seasons survey: Spring, Fall, Spring, Winter, Fall, Summer, Spring, Fall Mode = Spring and Fall (each appears 3 times — bimodal). Mean and median do not apply.
Key Takeaways
The mean, median, and mode each measure a different aspect of central tendency, and choosing the right one depends on your data's shape, type, and the presence of outliers.
| Point | Details |
|---|---|
| Mean for symmetric data | Use the mean when data is symmetric and free of extreme outliers. |
| Median for skewed data | The median resists outliers and is the better choice for skewed distributions. |
| Mode for categories | The mode is the only measure that works for nominal (categorical) data. |
| Always name your measure | Saying "average" without specifying mean, median, or mode causes confusion. |
| Apexapro calculator | Use the free Apexa Pro tool at apexapro.com to verify hand calculations instantly. |
Why reporting all three measures matters
Teaching mean, median, and mode as a trio rather than picking one and ignoring the others is the approach that actually builds statistical literacy. Reporting only the mean, for instance, can paint a misleading picture the moment your data has a single dramatic outlier. Reporting mean and median together takes seconds and immediately signals whether skew is present. When the two values are close, the mean is trustworthy; when they diverge, the median is the honest summary and the gap itself is worth explaining.
The mode adds a third dimension that the other two cannot provide: it tells you what is most common, not just what is central. For a teacher reviewing test scores, the mode reveals the score cluster where most students landed. For a retailer tracking shoe sales, the mode is the only number that matters for inventory decisions.
Try the Apexa Pro free calculator now
Checking your mean, median, and mode by hand is the best way to learn. Verifying those answers instantly is the best way to build confidence.
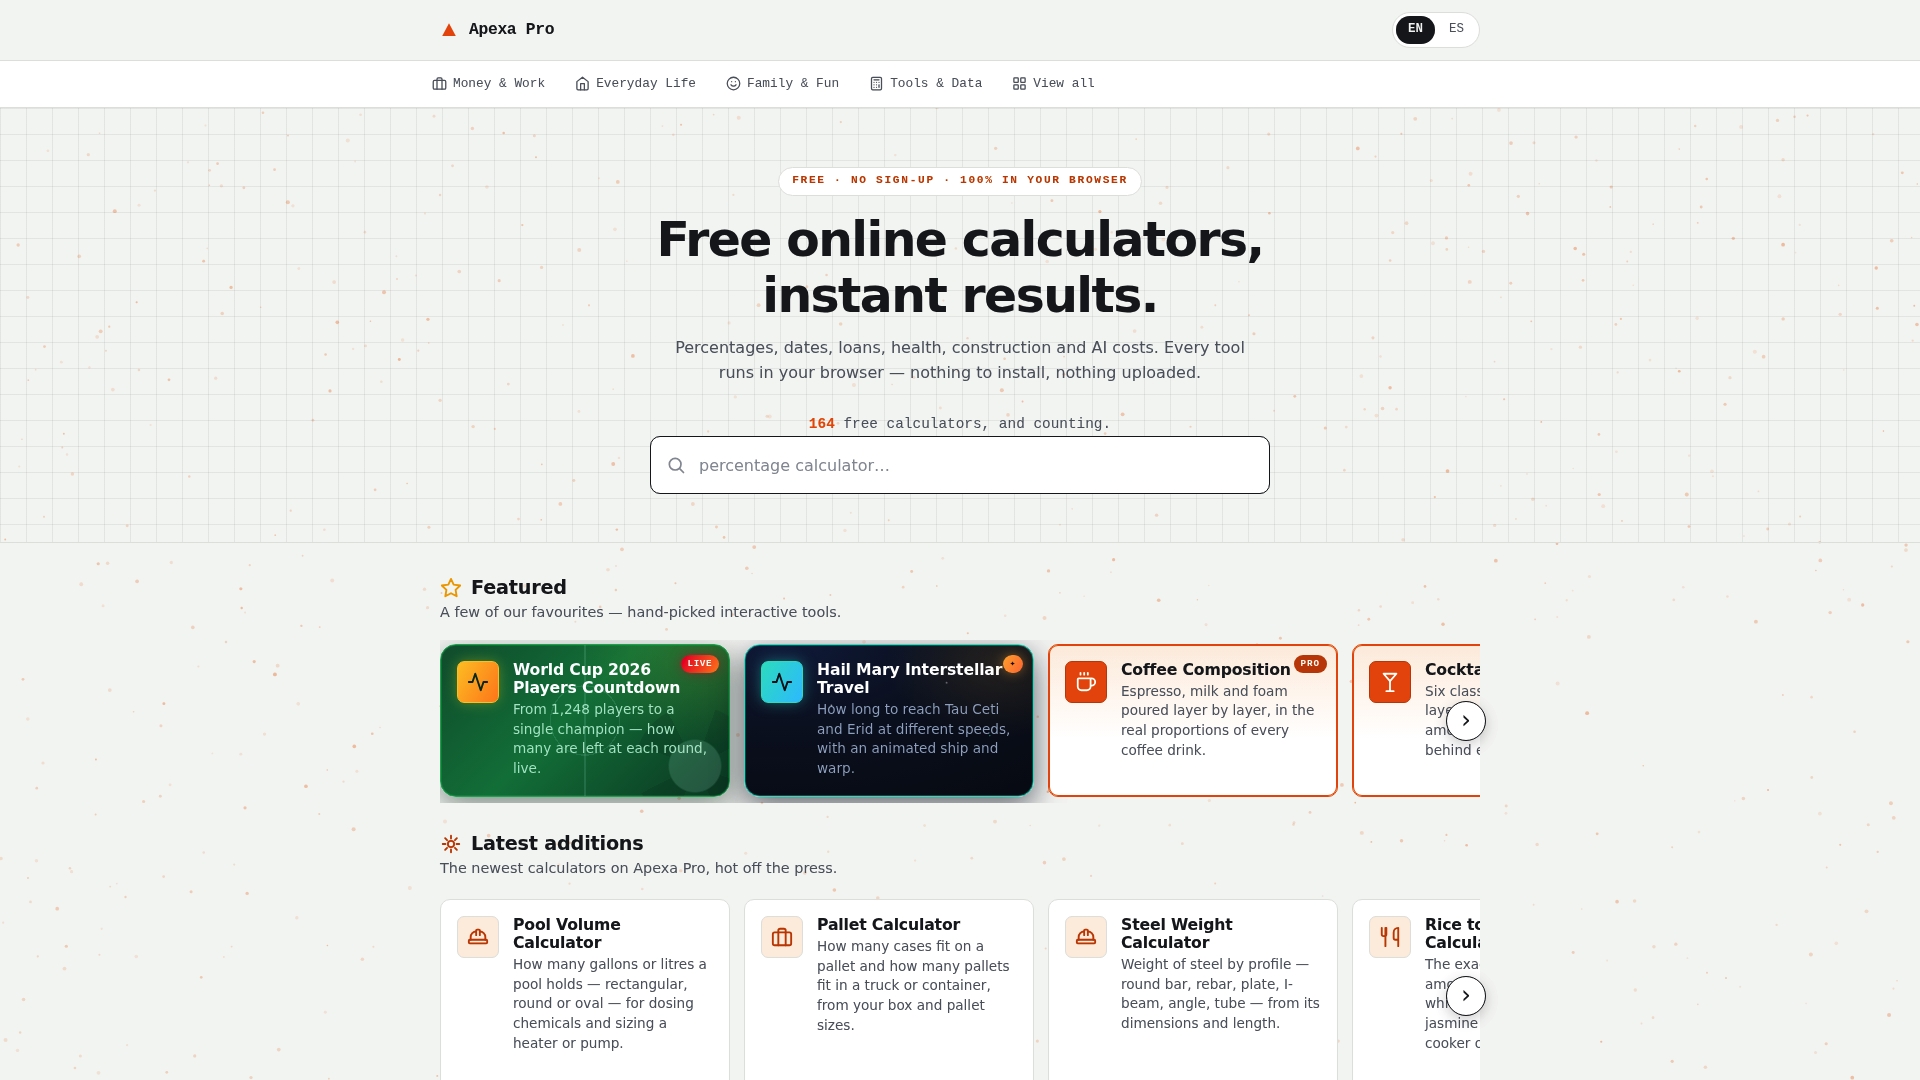
The Apexa Pro calculator handles all three measures in one place, runs entirely in your browser, and requires zero sign-up. It is also fully bilingual in English and Spanish, so it works for learners and classrooms across the United States. Enter any dataset, get your results, and move on. Head to apexapro.com to run your first calculation right now.
Useful sources for further reading
- Measures of Central Tendency — LibreTexts Statistics — thorough textbook-style coverage of definitions, formulas, and distribution shapes; best for theory.
- Mean, Mode and Median — Laerd Statistics — clear guidance on when each measure is appropriate, with practical examples including income reporting.
- Mean vs. Median — Statistics By Jim — focused comparison of mean and median with strong coverage of outlier impact and skew diagnosis.
- Mean vs. Median — DataCamp Tutorial — practical, data-science-oriented walkthrough with visualization recommendations.
- Mean, Median, and Mode — Mathematics LibreTexts — application problems and worked examples; strong for classroom teaching.
- Average vs. Mean vs. Median vs. Mode — Dictionary.com — accessible explainer with the worked dataset example used throughout this article.
- Apexa Pro — Free Online Calculators — interactive mean/median/mode calculator with no sign-up required; bilingual English/Spanish support.