The inflation rate is the percentage change between two price index values, and the formula is ((New index − Old index) / Old index) × 100. Plug in the Consumer Price Index values from January and the prior January, say 211.080 and 202.416, and you get ((211.080 − 202.416) / 202.416) × 100, which works out to a 4.28% annual inflation rate. That's the whole formula. Everything else in this guide is about applying it correctly.
Here's the quick workflow you'll use every time:
- Pick your two index values. Choose the "new" (later) and "old" (earlier) index readings for the periods you're comparing.
- Subtract and divide. Take the new index minus the old index, then divide that result by the old index.
- Multiply by 100. That converts your decimal into a percentage, which is your inflation rate for that period.
Quick math check: 211.080 − 202.416 = 8.664. Divide 8.664 by 202.416 and you get 0.0428. Multiply by 100 and the annual inflation rate is 4.28%.
Key Takeaways
Calculating any inflation rate, monthly, annual, or cumulative, comes down to one formula: ((New index − Old index) / Old index) × 100, applied to two comparable index values.
| Point | Details |
|---|---|
| Master the core formula | ((New index − Old index) / Old index) × 100 works for any time period as long as both values come from the same series. |
| Match your periods | Compare the same calendar month across years for true year-over-year figures, not arbitrary date ranges. |
| Separate cumulative from annualized | Use (Index_end/Index_start − 1) × 100 for total change and the exponent formula for a yearly average rate. |
| Choose the right index | CPI-U fits most consumer questions; core CPI and the GDP deflator serve policy and macroeconomic analysis. |
| Skip the manual math | The Apexa Pro inflation calculator applies these same formulas instantly and free, with no sign-up required. |
Table of Contents
- What Does the Inflation Rate Actually Measure?
- How Do You Adapt the Formula for Different Time Periods?
- Step-by-Step: Calculating Inflation From Real CPI Data
- How Do You Calculate Inflation Over Multiple Years?
- Which Price Index Should You Actually Use?
- Can You Calculate Inflation in Excel or a Browser Calculator?
- What Are the Most Common Inflation Calculation Mistakes?
- Where Can You Get Reliable Index Data for Your Calculations?
- Try the Apexa Pro Inflation Calculator
- A Practical Note on Choosing the Right Index
- Calculate Your Inflation Rate Instantly With Apexa Pro
- Where to Verify Index Data and Methodology
- Frequently Asked Questions
- Sources
What Does the Inflation Rate Actually Measure?
Inflation is the percentage growth of a price index, not the raw point difference between two index readings. That distinction trips up more people than any other part of this calculation. A price index measures the general price level relative to a base year, while the inflation rate measures how fast that level is climbing.
Say the CPI moves from 300 to 309. The index rose 9 points, but the inflation rate is (9 / 300) × 100, or exactly 3%. Report "9" as your inflation number and you've made a rookie mistake that shows up constantly in comment sections and, unfortunately, in some published articles too.
The purchasing-power angle makes this concrete. Your paycheck might stay flat in dollar terms, but its real value, what it can actually purchase, has shrunk. That's why economists care so much about the percent-change formula rather than the index level on its own: the level tells you where prices stand, but the rate tells you how your money is losing ground.
A few things worth keeping straight as you work through your own numbers:
- The index level (like "309") means nothing on its own. It's always relative to a base period.
- The inflation rate is always a comparison between two periods using the same index series.
- A rising index means prices are climbing; a rate near zero means prices are roughly stable, not that they're falling.
Pro Tip: Check whether the index you're using is seasonally adjusted before comparing short-term periods like month-to-month. Unadjusted data can swing wildly with predictable seasonal patterns (holiday shopping, gas price cycles), making a single month look far more dramatic than it really is.
How Do You Adapt the Formula for Different Time Periods?
The core formula never changes. What changes is which two index values you plug in. Whether you're calculating a monthly, quarterly, or annual rate, you're using the same structure: ((New index − Old index) / Old index) × 100.
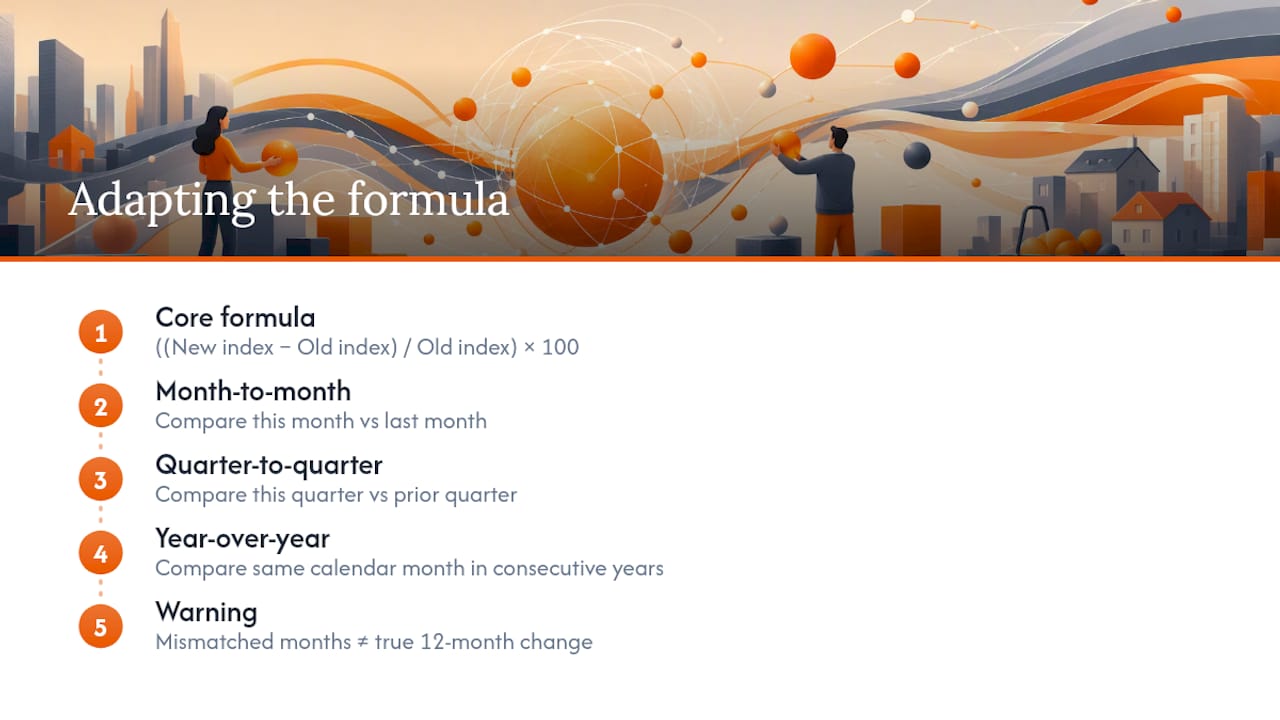
1. Month-to-month: Compare this month's index to last month's. Formula: ((Index_thismonth − Index_lastmonth) / Index_lastmonth) × 100
2. Quarter-to-quarter: Compare this quarter's average index to the prior quarter's. Formula: ((Index_thisquarter − Index_lastquarter) / Index_lastquarter) × 100
3. Year-over-year (annual): Compare the same month across two consecutive years, not two arbitrary months. Formula: ((Index_thisyear − Index_lastyear) / Index_lastyear) × 100
That last point matters more than it sounds. To get a true 12-month change, the beginning and ending periods must be the same calendar month, for example May 2025 against May 2026, not May 2025 against August 2026. Compare mismatched months and you're calculating something else entirely, an n-month change dressed up as an annual rate.
Annualizing a short period rate
Sometimes you have a monthly or quarterly rate and need to know what that pace would look like over a full year. This is where annualizing comes in, and it's different from simply multiplying by 12. The BLS uses compound growth math for annualizing percent changes rather than straight multiplication, because inflation compounds period over period the same way interest does.
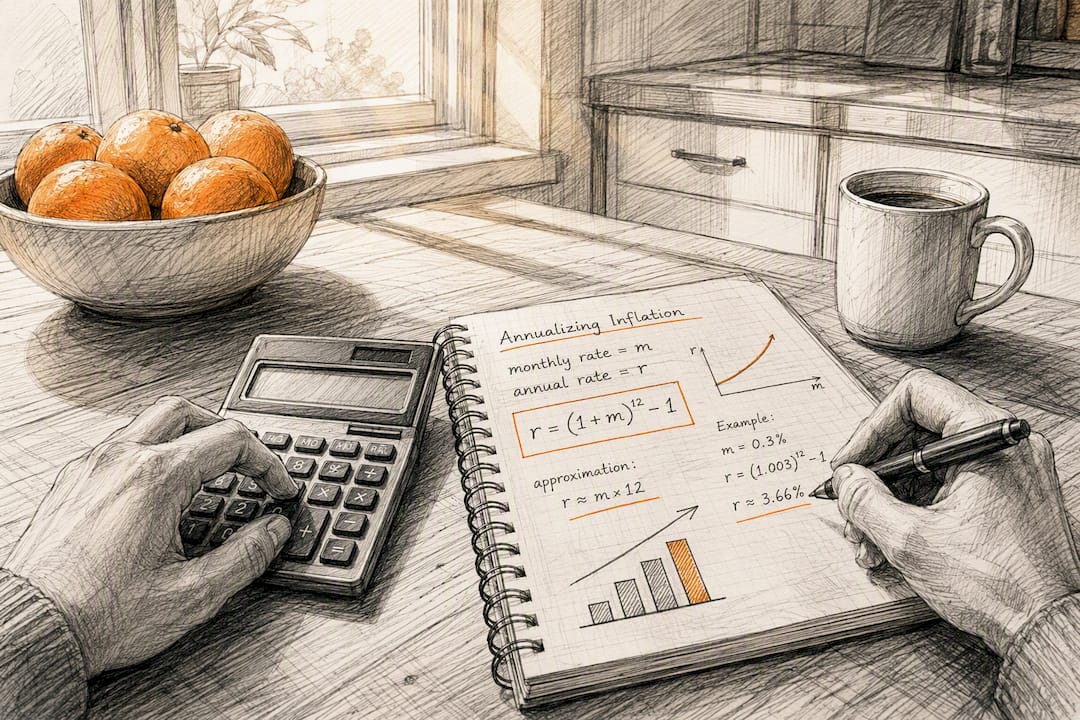
The annualized formula for a monthly rate looks like this: Annualized rate = ((1 + monthly rate)^12 − 1) × 100
The gap is small at low rates but widens fast when inflation runs hot, which is why serious analysis always uses the compound formula rather than the shortcut.
Percent vs. percentage point: don't mix these up
This distinction causes constant confusion in financial reporting. A percent change measures relative movement (inflation went from
to 4%, a 33% percent increase in the rate itself).- "Inflation rose from 3% to 4%" = a 1 percentage point increase, or equivalently a 33% relative increase.
- Headlines that say inflation "jumped 33%" when they mean it moved from 3% to 4% are technically using percent change correctly, but it's misleading without context. Always specify which one you mean.
Step-by-Step: Calculating Inflation From Real CPI Data
Let's walk through the arithmetic with actual numbers so you can replicate this on paper, in a spreadsheet, or on any calculator.
One-month example
Suppose the CPI-U index reads 314.540 in one month and 313.049 the prior month.
- Subtract: 314.540 − 313.049 = 1.491
- Divide by the old index: 1.491 / 313.049 = 0.004763
- Multiply by 100: 0.004763 × 100 = 0.48%
Small monthly numbers like this are normal. Multiply them out over 12 months (using the compound method above) and you'll see how they add up to the annual figures reported in the news.
One-year example (same month, two years apart)
Now the classic year-over-year case, using the BLS's own worked example: compare January's index of 211.080 to the prior January's 202.416.
- Subtract: 211.080 − 202.416 = 8.664
- Divide by the old index: 8.664 / 202.416 = 0.04281
- Multiply by 100: 0.04281 × 100 = 4.28%
Notice the precision here. The BLS carries index values to three decimal places specifically to avoid rounding artifacts that creep in when you round too early. If you round 211.080 to 211.1 and 202.416 to 202.4 before dividing, your final percentage shifts slightly, usually not enough to matter for casual use, but enough to matter if you're citing the figure professionally.
Data callout: The exact index values and this worked example come straight from the BLS CPI math calculations fact sheet. If you're replicating this at home, pull your own index numbers from the same source series (both values need to come from the identical CPI variant and the identical base period) to avoid comparing apples to oranges.
The CORE Econ textbook frames this as a three-step chain worth remembering: find the cost of a representative basket, convert that basket cost into an index (basket price divided by base-year basket price, times 100), then apply the percent-change formula to two index readings. Once you understand that chain, every inflation calculation you'll ever run is just a variation on the same three moves.
How Do You Calculate Inflation Over Multiple Years?
Cumulative inflation tells you the total price increase across a stretch of years, while an annualized rate tells you the average yearly pace over that same stretch. They answer different questions, and mixing them up leads to some genuinely bad financial decisions, especially around long-term contracts.
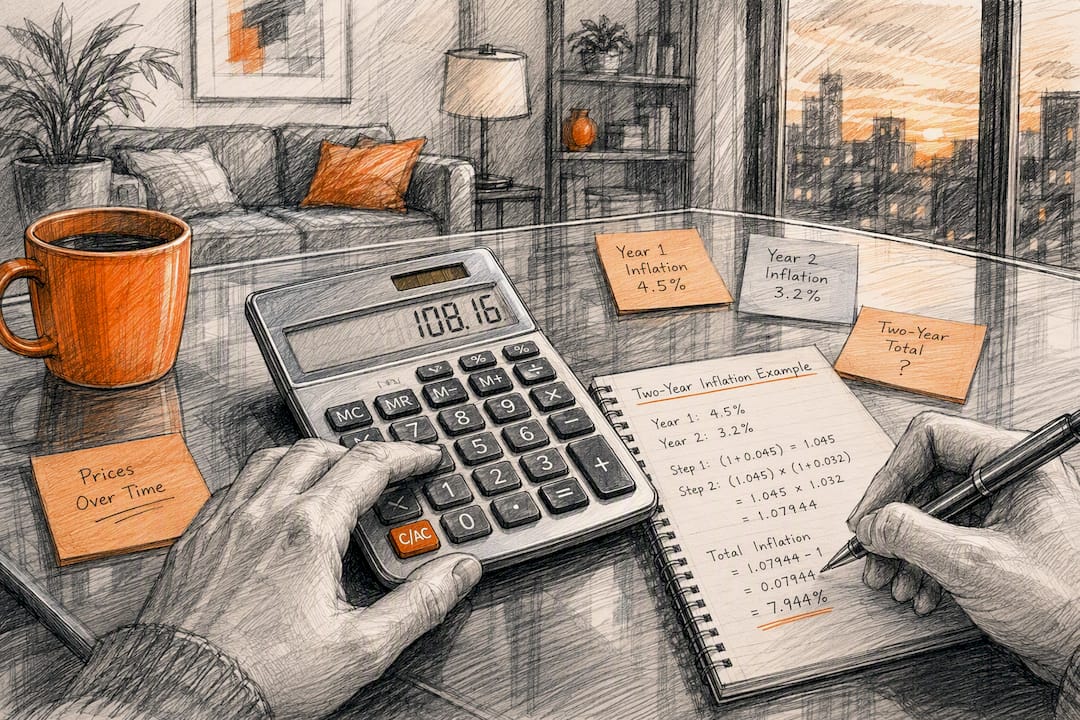
1. Cumulative (total) inflation formula: (Index_end / Index_start − 1) × 100
2. Annualized inflation formula: ((Index_end / Index_start)^(1/years) − 1) × 100
Two-year example
Say an index moves from 250 to 270 over two years.
Five-year example
Now stretch it to five years, with the index moving from 250 to 300.
Use cumulative totals when you need the full picture over a fixed window, like showing how much a fixed pension has lost in real value since it was set. Use the annualized rate when you're comparing to other yearly figures, like interest rates, wage growth, or contract escalation clauses that specify "annual adjustment."
- Rent and lease escalation clauses typically reference the annualized rate, not the cumulative figure.
- Retirement and pension cost-of-living adjustments often use cumulative inflation over the period since the last adjustment.
- Academic and cross-country comparisons almost always standardize to annualized rates for consistency.
Which Price Index Should You Actually Use?
Not every inflation question calls for the same index, and picking the wrong one produces a number that's technically correct but answers the wrong question.
- CPI-U (Consumer Price Index for All Urban Consumers): The most widely cited headline inflation figure in the U.S., covering roughly 93% of the population.
- CPI-W (Consumer Price Index for Urban Wage Earners and Clerical Workers): A narrower basket used to calculate Social Security cost-of-living adjustments.
- Core CPI: CPI-U or CPI-W with food and energy prices stripped out, used by policymakers to gauge underlying inflation trends without volatile commodity swings.
- C-CPI-U (Chained CPI): Adjusts for the fact that consumers substitute cheaper goods when prices rise, generally running slightly lower than standard CPI-U.
- GDP deflator: Measures price changes across the entire economy (not just consumer purchases), making it the broader macroeconomic gauge economists use for output comparisons.
Consumer-facing tasks, like adjusting a household budget or checking whether your raise kept pace with prices, call for headline CPI-U. Corporate escalation clauses and long-term contracts often specify a particular series in the contract language itself, so check that first before assuming CPI-U applies. Academic and cross-country GDP comparisons typically lean on the deflator instead.
The differences between these indices aren't arbitrary. The BLS constructs CPI variants using different aggregation formulas, including geometric means, modified Laspeyres weighting, and Törnqvist formulas, each approximating a true cost-of-living index in a slightly different way. That's a large part of why CPI-U and the chained C-CPI-U can diverge by several tenths of a percentage point in the same period even though they're measuring overlapping baskets.
Pro Tip: If you're calculating personal inflation rather than the official rate, remember that your own spending mix rarely matches the government's basket. Someone who spends heavily on housing and healthcare will experience a different personal inflation rate than the headline CPI suggests, sometimes by several points in either direction.
Can You Calculate Inflation in Excel or a Browser Calculator?
Yes, and the formulas are short enough to type from memory once you've done it a few times.
1. Simple percent change (month-to-month or year-over-year):
=(B2-A2)/A2*100
Here A2 holds your old index value and B2 holds your new one. If A2 is 202.416 and B2 is 211.080, this formula returns 4.28.
2. Annualized multi-year rate:
=((B2/A2)^(1/C2)-1)*100
A2 is the starting index, B2 is the ending index, and C2 is the number of years between them. Using the five-year example above (250 to 300 over 5 years), this returns roughly 3.71.
3. Formatting the cell: If you want Excel to display the result with a percent sign automatically, drop the *100 from the formula and format the cell as a percentage instead.
A quick worked example with sample values: put 202.416 in A2 and 211.080 in B2. The formula =(B2-A2)/A2*100 returns 4.28, matching the BLS example exactly. If instead B2 were smaller than A2, say the index fell from 202.416 to 198.000, the formula returns a negative number (about −2.18), which represents deflation, a shrinking price level rather than a rising one. Excel handles negative results without any special formula changes.
For anyone who'd rather skip cell references entirely, the Apexa Pro inflation calculator runs the identical math in your browser. Paste in your starting and ending index values, and it returns the percent change instantly without you needing to remember the formula syntax at all.
What Are the Most Common Inflation Calculation Mistakes?
A handful of errors show up again and again, and they're almost all avoidable once you know to watch for them.
- Subtracting index points instead of calculating percent change. An index moving from 300 to 309 is a 3% inflation rate, not "9."
- Mixing base periods. Always verify that both index values reference the same base year before comparing them; a rebased series can look artificially different from an older one covering the same months.
- Comparing mismatched months for a "year-over-year" figure. March 2026 against November 2025 is an 8-month change, not an annual one, even though it spans parts of two different years.
- Confusing an annual average with the over-the-year change. These are different calculations that frequently produce different numbers for the same year.
- Rounding too early. Round your index values before dividing and small errors compound into a final percentage that's noticeably off.
The BLS recommends carrying index values to three decimal places internally and only rounding the final percentage for presentation. That single habit eliminates most of the rounding complaints that pop up when two people calculate "the same" inflation rate and get slightly different answers.
Pro Tip: When you see a headline inflation number, check whether it's seasonally adjusted, unadjusted, "core," or headline before comparing it to your own calculation. These four flavors of the same underlying data can differ by a percentage point or more in any given month, and reporters don't always specify which one they're citing.
Where Can You Get Reliable Index Data for Your Calculations?
The formula is only as good as the numbers you feed it, so sourcing matters. The Bureau of Labor Statistics publishes downloadable CPI tables with historical index values you can copy directly into a spreadsheet, going back decades for most major series. The Federal Reserve Bank of St. Louis's FRED database mirrors much of this data with easier charting tools if you want to visualize trends alongside your calculations.
A few practical notes before you pull numbers:
- Confirm which CPI variant the series represents (CPI-U, CPI-W, or chained) before comparing it to another source's figure.
- Check whether the series is seasonally adjusted; mixing adjusted and unadjusted data in the same comparison produces misleading results.
- Watch for revisions. Preliminary monthly figures sometimes get revised in later releases, so a calculation done the week data drops can shift slightly once the final numbers post.
The Cleveland Fed notes that statistical agencies always compare index values for genuinely comparable periods, month-to-month, quarter-to-quarter, or year-to-year, rather than arbitrary date ranges. That consistency is what makes published inflation figures comparable across time in the first place.
Try the Apexa Pro Inflation Calculator
Running these formulas by hand is useful for understanding the math, but once you're comfortable with the concept, a calculator saves time and cuts out arithmetic slips. Here's how the Apexa Pro inflation calculator handles it:
- Enter your starting index value (the "old" number from your CPI or other index series).
- Enter your ending index value (the "new" number for the period you're comparing).
- Choose your frequency (monthly, quarterly, annual, or multi-year) so the tool applies the right variant of the formula.
- Click calculate to get your result instantly.
The output shows your percent change, an annualized rate when relevant, and a small summary table of the inputs and outputs you entered, so you can double-check your work at a glance.
- Results appear instantly with no page reload or waiting.
- Built-in annualizing option handles the compound math automatically, so you don't need to remember the exponent formula.
- Full bilingual support in English and Spanish.
- No sign-up, no downloads, nothing to install.
A Practical Note on Choosing the Right Index
Picking the right formula is the easy part. Picking the right index series is where most personal calculations go sideways. If you're trying to figure out whether your own cost of living outpaced your raise, headline CPI-U will get you in the right neighborhood, but it won't be exact. Your rent, your commute, your grocery basket, none of it maps perfectly onto the government's representative basket, and that gap can run several percentage points wide depending on your spending pattern.
My advice: use official CPI figures for anything involving contracts, legal disputes, or comparisons to published economic data, since that's the standard everyone else is using too. But if you're just trying to understand your own budget, build a rough personal basket, rent, groceries, utilities, transportation, weighted by what you actually spend, and run the same formula against your own numbers year over year. The formula doesn't care whose basket you feed it. It just measures how much that basket's price moved.
That's the real value of knowing this calculation cold. It's not an academic exercise. It's a tool you can point at your own budget, a client's contract, or a landlord's rent increase and get a straight, defensible answer.
Calculate Your Inflation Rate Instantly With Apexa Pro
You now know the formula, the variants, and the common mistakes that trip people up. The next step is skipping the manual arithmetic altogether. The Apexa Pro inflation calculator runs every formula covered in this guide, month-to-month, year-over-year, cumulative, and annualized, without asking you to remember a single equation or open a spreadsheet.
It's free, requires no sign-up, and returns results the moment you enter your two index values. The interface works in English or Spanish, and the animated output makes it easy to see exactly how your percent change was calculated, useful whether you're checking a landlord's rent increase, verifying a contract escalation clause, or just curious how your raise stacked up against last year's prices. Head to Apexa Pro and enter your own numbers to see your inflation rate in seconds.
Where to Verify Index Data and Methodology
- Bureau of Labor Statistics (BLS): The primary source for CPI-U, CPI-W, and core CPI values, plus detailed methodology notes on index construction.
- FRED (Federal Reserve Bank of St. Louis): A searchable database of CPI, GDP deflator, and related economic series with built-in charting.
- IMF: Background on how inflation measurement differs across countries and why personal inflation rates diverge from official figures.
- CORE Econ and OpenStax: Textbook-level explanations of the basket-to-index-to-inflation calculation chain, useful for building intuition before working with real data.
When pulling a series for your own calculation, confirm whether it's seasonally adjusted or not. Seasonally adjusted data smooths out predictable monthly patterns and works best for short-term comparisons, while unadjusted data is often preferred for exact year-over-year matching against the same calendar month.
Frequently Asked Questions
What is the basic formula for calculating the inflation rate? The formula is ((New index − Old index) / Old index) × 100. Subtract the older index value from the newer one, divide by the older value, then multiply by 100 to get a percentage.
How do I calculate inflation using CPI data specifically? Take the CPI value for your ending period, subtract the CPI value for your starting period, divide the result by the starting period's CPI, and multiply by 100. Using 211.080 and 202.416 as CPI values produces a 4.28% rate, the same math as the general formula.
What's the difference between the inflation rate and the GDP deflator? CPI measures price changes for a fixed basket of consumer goods and services, while the GDP deflator measures price changes across everything produced in the economy, including business investment and government spending. The deflator tends to be broader and less volatile than CPI in any given quarter.
Why does my personal inflation feel higher than the reported rate? Official CPI reflects a national average basket, but your actual spending on housing, food, or gas might rise faster or slower than that average. This gap between personal and headline inflation is well documented and explains why the reported rate doesn't always match your lived experience.
How do I annualize a monthly inflation rate? Use the compound formula: ((1 + monthly rate)^12 − 1) × 100, rather than simply multiplying the monthly rate by 12. The compound method accounts for the fact that inflation builds on itself each month rather than adding up linearly.
Can I calculate inflation without knowing the exact CPI formula? Yes. Tools like the Apexa Pro inflation calculator handle the math automatically. Enter your starting and ending index values, and the calculator returns the percent change and annualized rate without requiring you to type out the formula yourself.
This article is general information, not a substitute for advice from a qualified financial advisor. Consult a qualified financial professional about your own circumstances before acting on anything here.