
What are NPV and IRR, and why do they matter?
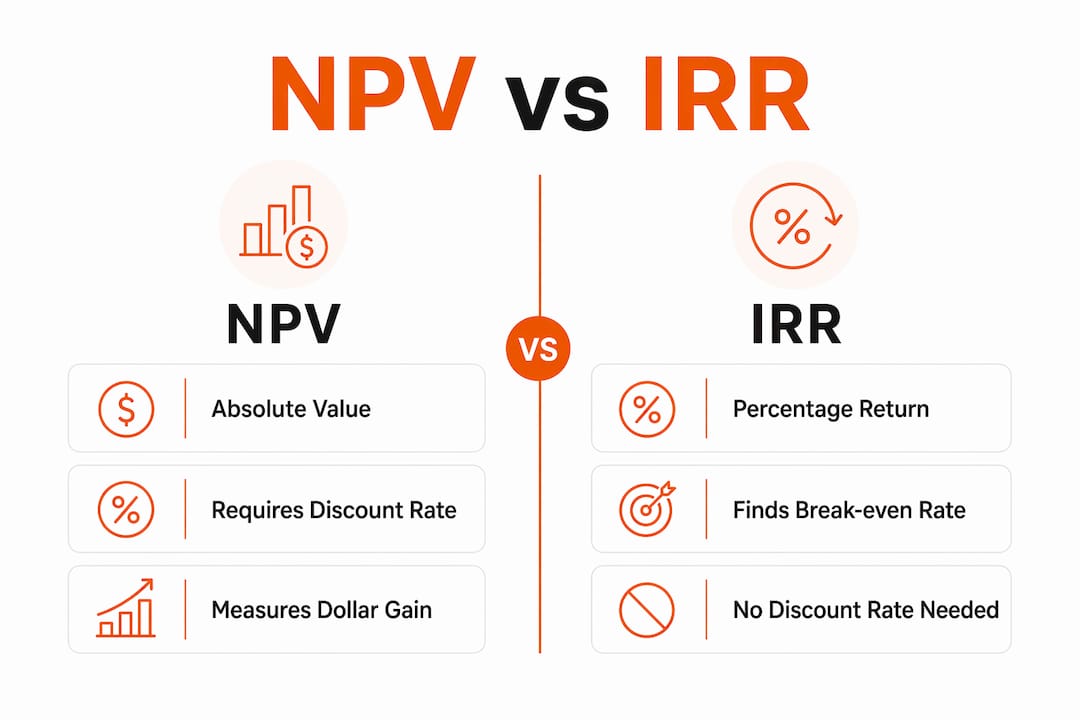
and Internal Rate of Return (IRR) are the two most widely used financial metrics for evaluating whether an investment is worth pursuing. NPV tells you the absolute dollar value an investment adds today, after discounting all future cash flows back to the present. IRR tells you the annual percentage return the investment generates, expressed as the discount rate that makes NPV exactly zero.Both metrics answer the same underlying question from different angles: is this investment profitable? Together, they form the backbone of investment appraisal techniques used by analysts, project managers, and business students alike.
Key points to keep in mind before diving into the calculations:
- NPV measures wealth creation in dollars. A positive NPV means the investment adds value; a negative NPV means it destroys it.
- IRR measures efficiency as a rate. Compare it against your required return (hurdle rate) to decide.
- Both rely on the time value of money: a dollar today is worth more than a dollar received a year from now, because today's dollar can be invested and earn a return.
- Neither metric works well in isolation. Used together, they give a fuller picture of any investment.
- When NPV and IRR conflict, NPV is generally the more reliable guide for maximizing total value.
Table of Contents
- How do you calculate Net Present Value?
- How do you calculate Internal Rate of Return?
- A side-by-side example: NPV and IRR on the same project
- How to calculate NPV and IRR in Excel
- NPV vs. IRR: strengths, weaknesses, and when to trust each
- Try Apexapro's free interactive NPV and IRR calculator
- How risk and sensitivity analysis strengthen your NPV and IRR results
- Key Takeaways
- Run your own numbers with Apexapro's free finance tools
How do you calculate Net Present Value?
NPV sums the present values of all future cash flows from a project, then subtracts the initial investment. The formula is:
NPV = Σ [Cₜ ÷ (1 + r)ᵗ] − C₀
Where:
- Cₜ = cash flow in period t
- r = discount rate (your required rate of return or cost of capital)
- t = time period (year 1, year 2, etc.)
- C₀ = initial investment (a cash outflow, so it's negative)
Simple NPV example
Suppose you invest $10,000 today in a project that returns $4,000 at the end of Year 1, $4,000 at the end of Year 2, and $5,000 at the end of Year 3. Your discount rate is 10%.

| Year | Cash Flow | Discount Factor (10%) | Present Value |
|---|---|---|---|
| 0 | −$10,000 | — | −$10,000 |
| 1 | $4,000 | — | — |
| 2 | $4,000 | — | — |
| 3 | $5,000 | — | — |
| NPV | $699 |
The NPV is +$699. That positive result means the project is expected to add $699 of value above and beyond your 10% required return. Accept it. If the NPV had come out negative, the project would not cover your cost of capital and should be rejected.
How do you calculate Internal Rate of Return?
IRR is the discount rate that makes NPV equal to zero. There is no direct algebraic formula to solve for it; you find it through iteration, trying different rates until NPV hits zero.
The equation you are solving is:
0 = Σ [Cₜ ÷ (1 + IRR)ᵗ] − C₀
Simple IRR example
Using the same project ($10,000 investment, cash flows of $4,000 / $4,000 / $5,000):
| Trial Rate | Calculated NPV |
|---|---|
| 10% | +$699 |
| above 10% | — |
| above 10% | ≈ $0 |
The IRR exceeds the 10% hurdle rate, so the project clears the bar. In practice, Excel's IRR() function handles this iteration instantly.
- Start with a rate below your expected IRR (try 10%).
- Calculate NPV at that rate. If positive, try a higher rate.
- Narrow the range until NPV approaches zero.
- The rate at which NPV = 0 is the IRR.
A side-by-side example: NPV and IRR on the same project
Walk through a slightly larger project to see how both metrics work together and where they can diverge.

Project details: Initial investment of $20,000. Cash flows: Year 1 = $6,000; Year 2 = $7,000; Year 3 = $8,000; Year 4 = $9,000. Discount rate = 10%.
NPV calculation steps
- Discount Year 1: $6,000 ÷ 1.10 = $5,455
- Discount Year 2: $7,000 ÷ 1.21 = $5,785
- Discount Year 3: $8,000 ÷ 1.331 = $6,011
- Discount Year 4: $9,000 ÷ 1.464 = $6,148
- Sum of present values: $23,399
- NPV = $23,399 − $20,000 = +$3,399
IRR calculation result
Running the same cash flows through iteration (or Excel's IRR function) yields an IRR well above the 10% hurdle rate.
Both metrics agree here: accept the project. NPV is positive, and IRR exceeds the required return.
- When they agree: Both positive NPV and IRR above the hurdle rate signal a clear "go."
- When they conflict: On mutually exclusive projects of different sizes, a smaller project might show a higher IRR but a lower absolute NPV. In that case, prioritize NPV because it reflects total wealth added, not just efficiency.
- Key assumption: These calculations assume cash flows arrive at year-end and the discount rate stays constant throughout.
How to calculate NPV and IRR in Excel
Excel's built-in functions make these calculations fast and reliable once you understand the syntax.
-
Set up your data. Enter cash flows in a column, starting with the initial investment as a negative number in cell B1 (e.g., −$20,000), then Year 1 through Year 4 flows in B2:B5.
-
NPV() function. Type
=NPV(0.10, B2:B5) + B1. The NPV() function discounts the future cash flows (B2:B5) at 10%, but it does NOT include the Year 0 investment automatically, so you add B1 separately. -
IRR() function. Type
=IRR(B1:B5). This includes all cash flows, starting from the initial outflow. Excel iterates automatically and returns the IRR as a percentage. -
XNPV() and XIRR() for irregular intervals. When cash flows do not arrive on exact annual anniversaries, use
=XNPV(rate, values, dates)and=XIRR(values, dates). These functions accept a column of actual dates alongside the cash flows, giving more accurate results for real-world projects. -
Common pitfall. The NPV() function name is misleading: it calculates the present value of future cash flows only. Always add the initial investment as a separate term outside the function, or your result will be overstated.
Pro Tip: Use XIRR over IRR whenever your project has cash flows tied to specific calendar dates rather than neat annual periods. The difference in output can be meaningful for multi-year projects.
NPV vs. IRR: strengths, weaknesses, and when to trust each
Understanding the difference between NPV and IRR goes beyond the math. Each metric carries assumptions that can lead to very different conclusions.
NPV strengths and weaknesses:
- Measures absolute dollar value added, making it directly tied to wealth creation.
- Handles varying discount rates across periods without distortion.
- Assumes reinvestment at the cost of capital, which is realistic for most businesses.
- Requires you to specify a discount rate upfront, which can be subjective.
IRR strengths and weaknesses:
- Easy to communicate: "This project returns 18%" is intuitive for non-finance audiences.
- No discount rate needed to compute it, reducing one source of subjectivity.
- Assumes reinvestment at the IRR itself, which often overstates real-world returns.
- Can produce multiple IRRs when cash flows change sign more than once (e.g., a project with a large cleanup cost at the end), making interpretation unreliable.
When they conflict on mutually exclusive projects: Suppose Project A has an NPV of $50,000 and an IRR of 15%, while Project B has an NPV of $30,000 and an IRR of 22%. IRR says choose B; NPV says choose A. Firms maximize value by choosing A, because it adds $20,000 more to the company's wealth. IRR's higher percentage on a smaller base does not compensate for the lost absolute gain.
Practical decision rule: Use NPV as your primary criterion for any capital budgeting decision. Use IRR as a secondary check and as a communication tool with stakeholders who think in percentage terms. When they agree, you have strong confirmation. When they disagree, trust NPV.
Pro Tip: For projects with non-conventional cash flows (multiple sign changes), skip IRR entirely and rely on NPV or Modified IRR (MIRR), which Excel calculates with =MIRR(values, finance_rate, reinvest_rate).
Try Apexapro's free interactive NPV and IRR calculator
Seeing the formulas is one thing. Watching NPV shift in real time as you adjust the discount rate makes the concept click in a way that static examples cannot.
Apexapro's free browser-based NPV and IRR calculator lets you do exactly that:
- Enter your initial investment and up to several years of cash flows.
- Adjust the discount rate with a slider and watch the NPV update instantly.
- View a live chart of NPV vs. discount rate, so you can see visually where NPV crosses zero (that crossing point is the IRR).
- No sign-up, no download, and fully bilingual in English and Spanish.
- Open the calculator at apexapro.com.
- Input your project's cash flows.
- Set your discount rate.
- Read the NPV and IRR results, then explore the chart to understand sensitivity.
Apexapro builds practical finance tools for students and early-career professionals who need fast, reliable calculations without a spreadsheet setup. The NPV and IRR calculator is one of dozens of free tools available instantly in your browser.
How risk and sensitivity analysis strengthen your NPV and IRR results
A single NPV or IRR figure is only as reliable as the assumptions behind it. Sensitivity analysis tests how much your result changes when one input shifts, revealing which variables carry the most risk.
The most common approach is to recalculate NPV across a range of discount rates, from optimistic (low rate) to pessimistic (high rate). If NPV stays positive across the full range, the project is resilient. If it turns negative with a modest rate increase, the decision is fragile.
Scenario analysis takes this further by changing multiple inputs at once. A "base case," "best case," and "worst case" set of cash flow assumptions gives you a range of NPV outcomes rather than a single point estimate. For IRR, the equivalent check is comparing the IRR against a range of plausible hurdle rates, not just one fixed benchmark.
Discount rates in NPV reflect project-specific risk profiles, which is one reason NPV handles risk more explicitly than IRR. A riskier project warrants a higher discount rate, which directly reduces NPV and raises the bar for acceptance. IRR, by contrast, produces one number that you then compare to a separately chosen hurdle rate, keeping risk assessment one step removed from the metric itself.
For value investing decisions, sensitivity analysis is particularly valuable because small changes in growth assumptions can swing NPV dramatically. Running at least three scenarios before committing to a capital decision is standard practice in professional finance.
Key Takeaways
NPV and IRR together give you the clearest picture of investment value: NPV measures total dollars added, IRR measures the rate of return, and when they conflict, NPV is the more reliable guide.
| Point | Details |
|---|---|
| NPV measures absolute value | A positive NPV means the investment adds dollars above your required return. |
| IRR is a rate, not a dollar amount | Compare IRR to your hurdle rate; above it means the project clears the bar. |
| Reinvestment assumptions differ | IRR assumes reinvestment at its own rate; NPV assumes reinvestment at cost of capital, which is more realistic. |
| Multiple IRRs are a real risk | Non-conventional cash flows can produce several IRRs, making the metric unreliable in those cases. |
| Apexapro's free calculator | Try the interactive NPV and IRR tool at apexapro.com to visualize results with a live discount-rate chart. |
Run your own numbers with Apexapro's free finance tools
Spreadsheets are powerful, but setting one up from scratch takes time you may not have when you are learning the concepts or working through a quick project evaluation.

Apexapro's free NPV and IRR calculator gives you a ready-to-use tool that runs entirely in your browser, with no account required. Enter your cash flows, set a discount rate, and get instant results alongside a live chart showing how NPV changes as the rate moves. That visual is worth more than a dozen static examples when you are building intuition for how these metrics behave. The tool is available in both English and Spanish, making it accessible for a wider range of students and professionals.
Head to Apexapro now, open the NPV and IRR calculator, and run the numbers on a project you are actually evaluating.