
The seven marginal federal income tax rates for 2026 are 10%, 12%, 22%, 24%, 32%, 35%, and 37%. These rates apply to taxable income, not gross income, and the thresholds for each bracket have been adjusted upward for inflation under IRS Revenue Procedure 2025-32. The top rate of 37% kicks in above $640,600 for single filers and $768,700 for married filing jointly.
The official verification source is the IRS tax rates and brackets page, which mirrors the Revenue Procedure figures. One detail worth keeping front of mind: these are marginal rates. Only the income that falls inside a given bracket gets taxed at that bracket's rate.
- Seven rates: 10%, 12%, 22%, 24%, 32%, 35%, 37%
- Source document: IRS Revenue Procedure 2025-32
- Applies to: taxable income (AGI minus adjustments and deductions)
- Tax year 2026 returns are filed in 2027
Table of Contents
- 2026 federal income tax bracket tables by filing status
- How the 2026 standard deduction reduces your taxable income
- How marginal tax brackets actually work (and what your effective rate really means)
- How to figure out which 2026 bracket applies to you
- Other 2026 inflation-adjusted limits you should know about
- Why the IRS updates these numbers every year, and when 2026 figures apply
- Key Takeaways
- Why these bracket numbers matter more than most taxpayers realize
- Apexapro's free tax calculators make 2026 bracket math fast and clear
- Authoritative sources for 2026 federal tax figures
2026 federal income tax bracket tables by filing status
The tables below reflect the official 2026 thresholds from Revenue Procedure 2025-32 and are consistent with the multi-column format published by Fidelity. Read the column that matches your filing status, then apply each rate only to the income that falls within that range.
Important: These thresholds apply to taxable income, which is your adjusted gross income (AGI) after subtracting deductions. Do not apply them to your W-2 wages or gross pay.
| Rate | Single | Married Filing Jointly | Married Filing Separately | Head of Household |
|---|---|---|---|---|
| 10% | $0 – $12,400 | $0 – $24,800 | $0 – $12,400 | $0 – $17,700 |
| 12% | $12,401 – $47,150 | $24,801 – $94,300 | $12,401 – $47,150 | $17,701 – $63,100 |
| 22% | $47,151 – $100,525 | $94,301 – $201,050 | $47,151 – $100,525 | $63,101 – $106,800 |
| 24% | $100,526 – $191,950 | $201,051 – $383,900 | $100,526 – $191,950 | $106,801 – $202,150 |
| 32% | $191,951 – $243,725 | $383,901 – $487,450 | $191,951 – $243,725 | $202,151 – $243,700 |
| 35% | $243,726 – $640,600 | $487,451 – $768,700 | $243,726 – $384,350 | $243,701 – $640,600 |
| 37% | Over $640,600 | Over $768,700 | Over | Over $640,600 |
Source: IRS Revenue Procedure 2025-32. Verify exact thresholds at irs.gov before filing.
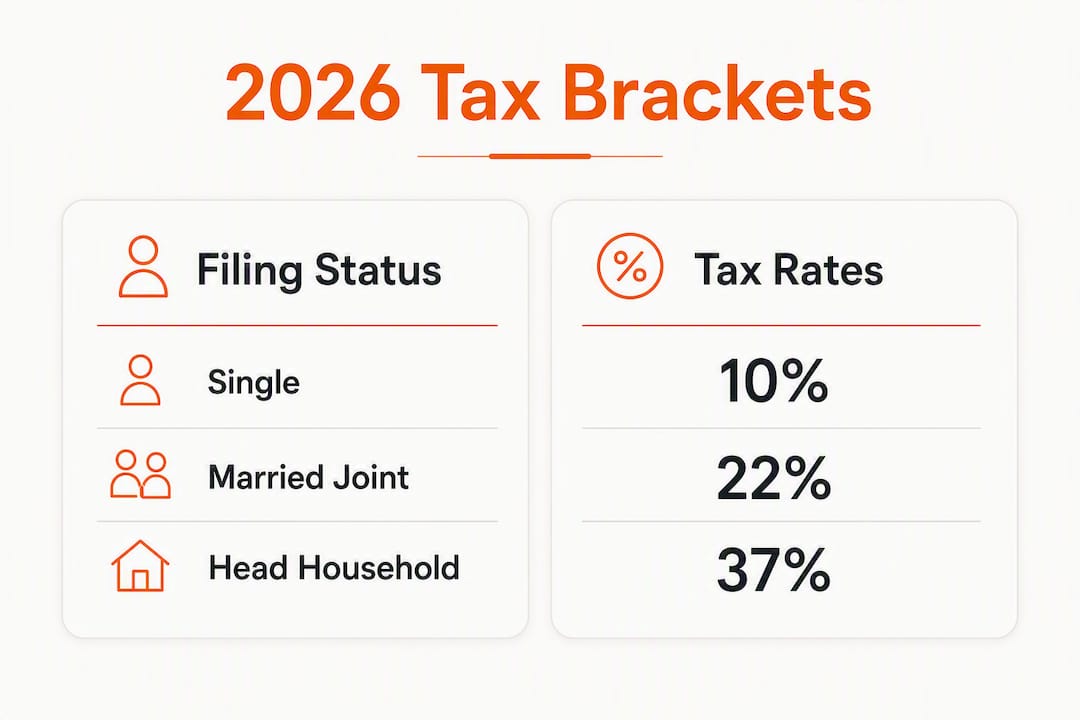
The Tax Foundation's 2026 bracket tables confirm these thresholds and note that the top marginal rate of 37% applies above $640,600 for single filers and $768,700 for married filing jointly.
How the 2026 standard deduction reduces your taxable income
Before you can apply the bracket table above, you need your taxable income. The standard deduction is the fastest way most taxpayers get there.
For 2026, the standard deduction amounts are:
- Single / Married filing separately: $16,100
- Married filing jointly: $32,200
- Head of household: $24,150
Taxpayers who are 65 or older, or blind, receive an additional amount on top of these figures. The IRS publishes the exact add-on amounts in Revenue Procedure 2025-32.
The formula is straightforward: Taxable income = AGI − above-the-line adjustments − deductions (standard or itemized). A single filer earning $75,000 in wages with no above-the-line adjustments would subtract $16,100 and arrive at $58,900 in taxable income before applying the bracket table.

One structural detail worth noting: the One, Big, Beautiful Bill applied a larger 4% cost-of-living adjustment to the bottom two brackets (10% and 12%) compared with roughly 2.3% for higher brackets. That asymmetry means lower-income earners saw a proportionally larger threshold shift in 2026 than higher earners did.
Pro Tip: Always calculate taxable income first. Applying bracket rates to gross wages is the single most common mistake taxpayers make, and it will overstate your federal tax bill significantly.
How marginal tax brackets actually work (and what your effective rate really means)
Moving into a higher bracket does not tax all of your income at the higher rate. Only the dollars that fall inside that bracket get taxed at that rate. The IRS is explicit about this in its federal income tax rates and brackets guidance: each layer of income is taxed at its own rate, and the rates stack from the bottom up.
Here is a step-by-step example for a single filer with $75,000 in taxable income in 2026:
- Total federal income tax: — $1,240 + $4,170 + $6,127 = $11,537
This filer is in the 22% marginal bracket, but their effective rate is 15.4%. That gap is why the marginal rate alone is a poor guide to actual tax burden.
The Bipartisan Policy Center's interactive calculator visualizes exactly this layered structure, which makes it easier to see how a raise or a bonus affects only the income above the current bracket threshold, not the income below it.

How to figure out which 2026 bracket applies to you
Knowing the bracket table is only useful once you have your taxable income. Here is the sequence:
- Start with gross income. Add wages, self-employment income, interest, dividends, and any other taxable sources.
- Subtract above-the-line adjustments. These include contributions to a traditional IRA, student loan interest, and self-employed health insurance premiums, among others. The result is your AGI.
- Choose standard or itemized deduction. For most taxpayers, the 2026 standard deduction ($16,100 single, $32,200 married filing jointly, $24,150 head of household) will exceed itemized deductions. Take whichever is larger.
- Subtract the deduction from AGI. The result is your taxable income.
- Find your filing status column in the bracket table and read which bracket your taxable income falls into.
Practical ways to reduce taxable income before year-end
Several legal strategies can lower the taxable income figure before you apply the brackets:
- Pre-tax retirement contributions — to a 401(k) or traditional IRA reduce AGI dollar-for-dollar. The IRS adjusts contribution limits annually; check the current limits at irs.gov before contributing.
Pro Tip: Use an interactive calculator to model the effect of a $5,000 or $10,000 pre-tax retirement contribution before you decide between a Roth and a traditional account. The bracket math often makes the answer clear faster than any rule of thumb.
Other 2026 inflation-adjusted limits you should know about
The bracket thresholds are not the only figures that shift each year. Several other limits directly affect how much tax you owe or how much you can shelter.
Key 2026 COLA-adjusted items from Revenue Procedure 2025-32:
- Retirement contribution limits: — 401(k), IRA, and HSA limits are adjusted annually. Confirm the 2026 figures at irs.gov before making year-end contributions.
Capital gains and qualified dividends are taxed separately
Long-term capital gains and qualified dividends are not taxed at ordinary income rates. They follow their own rate schedule (0%, 15%, or 20%) with separate thresholds that are also inflation-adjusted for 2026. The Tax Foundation's 2026 bracket analysis covers these thresholds alongside the ordinary-income brackets.
State and local income taxes operate on entirely different schedules. Federal figures from the IRS apply only to your federal return; check your state's department of revenue for state-specific rates and deductions.
Why the IRS updates these numbers every year, and when 2026 figures apply
The IRS issues annual inflation adjustments through a Revenue Procedure, a formal guidance document published in the Internal Revenue Bulletin. For 2026, that document is Revenue Procedure 2025-32, which also incorporates amendments from the One, Big, Beautiful Bill. Reading the Revenue Procedure directly is the definitive way to confirm any federal figure.
A few timing points that matter:
- When adjustments are published: — The IRS typically releases the following year's Revenue Procedure in the fall. Revenue Procedure 2025-32 covers tax year 2026.
The uneven COLA adjustment in 2026 (4% for the bottom two brackets, roughly 2.3% for higher ones) is a direct result of the OBBB amendments. That kind of legislative change can alter bracket math in ways that standard inflation-only projections miss, which is why the Revenue Procedure itself is always the authoritative source rather than any third-party projection.
Key Takeaways
The 2026 federal income tax system uses seven marginal rates applied in layers to taxable income, and your effective rate will always be lower than your top marginal rate.
| Point | Details |
|---|---|
| Seven marginal rates | Rates run 10%–37%; only income inside each bracket is taxed at that bracket's rate. |
| Standard deduction first | Subtract $16,100 (single), $32,200 (MFJ), or $24,150 (HOH) from AGI to reach taxable income. |
| Effective vs. marginal rate | A single filer with $75,000 taxable income pays an effective rate of 15.4%, not the 22% marginal rate. |
| Verify with IRS directly | Revenue Procedure 2025-32 and the IRS tax-rates page are the authoritative sources for all 2026 figures. |
| Use Apexapro to model scenarios | Apexapro's free browser-based calculators let you test pre-tax contributions and bracket shifts with no sign-up required. |
Why these bracket numbers matter more than most taxpayers realize
Most people check their bracket once a year, at filing time, when the decisions that could have changed the number are already behind them. That is the wrong sequence. The marginal rate you expect to land in for 2026 should be informing choices you make throughout the year: whether to contribute to a Roth or a traditional 401(k), whether to accelerate a bonus into 2026 or defer it, whether a charitable deduction is worth itemizing.
The asymmetric COLA adjustment in 2026 is a good example of why this matters. Lower-income earners saw a 4% threshold bump in the bottom two brackets, while higher earners saw roughly 2.3%. That is not a trivial difference for someone sitting near the 12%/22% boundary. A taxpayer who modeled their 2026 situation using 2025 thresholds could easily miscalculate which bracket a modest raise pushes them into.
The Bipartisan Policy Center's interactive tool and the IRS's own guidance both make the same point: visualizing the layers is more useful than memorizing the rates. Running the numbers with a calculator before making a contribution decision takes ten minutes and can save a meaningful amount in unnecessary tax. The bracket table is the starting point, not the finish line.
Apexapro's free tax calculators make 2026 bracket math fast and clear
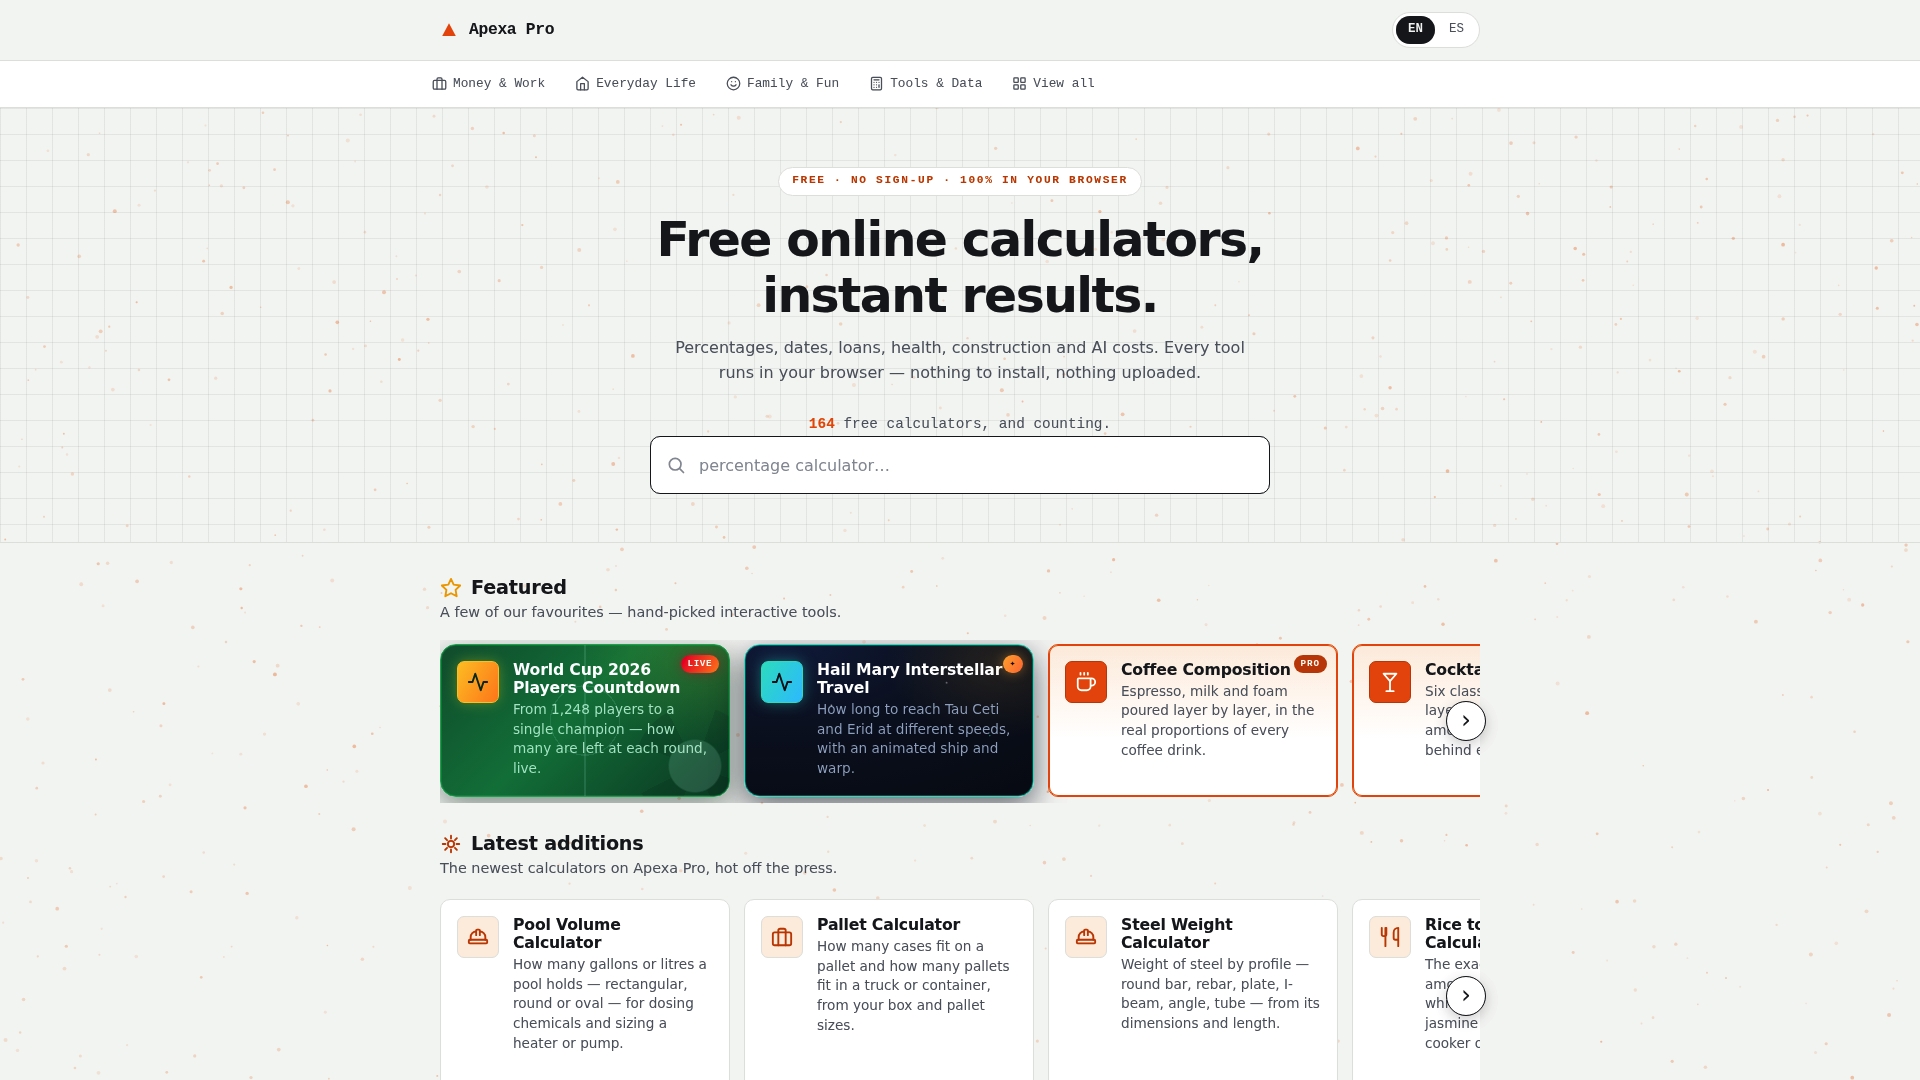
Understanding the 2026 federal tax brackets is one thing. Seeing exactly how they apply to your numbers is where the real planning happens. Apexapro offers free, browser-based finance calculators that let you model marginal-rate breakdowns, test the effect of pre-tax retirement contributions, and estimate your effective tax rate for 2026, all without creating an account or downloading anything.
Two ways to put the tools to work right now:
- Run a withholding check. Enter your expected 2026 taxable income and see which brackets your income passes through, and whether your current paycheck withholding is tracking close to your actual liability.
- Model a retirement contribution. Adjust a traditional 401(k) or IRA contribution amount and watch the taxable income figure drop in real time, showing you exactly which bracket dollars you are moving out of.
These calculators are estimates and are not a substitute for advice from a qualified tax professional. For official figures, always verify against IRS Revenue Procedure 2025-32. Head to Apexapro's free calculator catalog to run your 2026 numbers now.
Authoritative sources for 2026 federal tax figures
| Source | What it covers |
|---|---|
| IRS Revenue Procedure 2025-32 | The official document containing all 2026 inflation-adjusted figures, including bracket thresholds, standard deductions, AMT, and EITC amounts. |
| IRS federal income tax rates and brackets page | Consumer-facing IRS page with the seven rates and bracket ranges; updated each year. |
| IRS newsroom announcement for tax year 2026 | IRS press release summarizing key 2026 changes, including OBBB amendments. |
| Tax Foundation 2026 bracket tables | Clear, multi-column tables for all filing statuses; also covers capital gains thresholds and COLA analysis. |
| Bipartisan Policy Center 2026 explainer and calculator | Interactive tool for visualizing marginal-rate layers and testing income changes. |
| Fidelity 2025 and 2026 tax brackets | Side-by-side 2025/2026 comparison table across all four filing statuses; useful for year-over-year planning. |
To verify a specific threshold, open the Revenue Procedure PDF and locate the relevant table by filing status. Each table is labeled by rate and lists the taxable-income range for that bracket. For state and local tax rates, go directly to your state's department of revenue; federal figures from the IRS do not cover state obligations.
This article provides general information about federal tax law and is not professional tax advice. Confirm current rules with the IRS or a qualified tax professional before making financial decisions.