The two formulas you need are these. Population standard deviation: σ = √[Σ(xᵢ − μ)² / N]. Sample standard deviation: s = √[Σ(xᵢ − x̄)² / (n − 1)]. Use σ when you have data for every member of the group you care about. Use s when your data are a subset drawn from a larger group, and the (n − 1) denominator, known as Bessel's correction, prevents the estimate from being systematically too small.
| Formula | Symbol | Denominator | When to use |
|---|---|---|---|
| Population SD | σ | N | You measured every member of the group |
| Sample SD | s | n − 1 | Your data are a subset of a larger population |
Table of Contents
- What do all those symbols in the SD formula mean?
- How to calculate standard deviation step by step
- How variance and standard deviation connect
- How to verify your SD in Excel, Python, and R
- Common mistakes when computing standard deviation
- Key Takeaways
- Why formula-first teaching actually works
- Verify your results instantly with Apexapro's free SD calculator
- Useful sources
What do all those symbols in the SD formula mean?
Every symbol in the standard deviation formula carries a specific meaning, and mixing them up is the most common source of calculation errors. The table below defines each one precisely.
| Symbol | Name | Definition |
|---|---|---|
| σ | Population SD | The SD of an entire population |
| s | Sample SD | The SD estimated from a sample |
| μ | Population mean | Average of all N population values |
| x̄ | Sample mean | Average of the n sampled values |
| xᵢ | Individual value | Each data point in the set |
| N | Population size | Total count of population members |
| n | Sample size | Count of values in the sample |
| Σ | Summation | Add up all the terms that follow |
| σ² | Population variance | Average of squared deviations from μ |
| s² | Sample variance | Sum of squared deviations divided by (n − 1) |
The notation distinction between s and σ matters beyond labeling. As Penn State's STAT 200 course notes, s is the standard notation for sample SD and σ for population SD, and the two are not interchangeable in formulas or software calls.
One detail worth locking in: deviations are squared before summing because raw deviations always sum to zero. Squaring removes the sign, so larger deviations contribute more weight. The final square root then brings the result back to the same units as the original data, whether that is dollars, kilograms, or test scores.
How to calculate standard deviation step by step
The clearest way to see how the two formulas differ is to run both on the same data set. Use these eight values: 4, 7, 13, 2, 1, 9, 15, 5.
Step 1: Find the mean
Sum = 4 + 7 + 13 + 2 + 1 + 9 + 15 + 5 = 56 Mean = 56 / 8 = 7.00
Step 2: Compute each deviation and square it
| xᵢ | xᵢ − 7 | (xᵢ − 7)² |
|---|---|---|
| 4 | −3 | 9 |
| 7 | 0 | 0 |
| 2 | −5 | 25 |
| 1 | −— | — |
| 9 | 2 | 4 |
| 15 | 8 | — |
| 5 | −2 | 4 |
| Sum (SS) | 178 |
Step 3: Compute population SD (σ)
Population variance = SS / N = 178 / 8 σ = √22.25 ≈ 4.72
Step 4: Compute sample SD (s)
Sample variance = SS / (n − 1) = 178 / 7 s = √25.43 ≈ 5.04
The difference between 4.72 and 5.04 is not a rounding artifact. Dividing by 7 instead of 8 inflates the estimate slightly, which is exactly the point: Scribbr's step-by-step guide explains that using n would bias the sample estimate downward, understating how spread out the full population likely is. The NIH's health statistics resource shows the same stepwise logic applied to clinical data, confirming the procedure works identically across fields.
How variance and standard deviation connect
Variance and SD are two expressions of the same underlying quantity. Variance (σ² for a population, s² for a sample) is the mean of the squared deviations. Standard deviation is simply the square root of variance.
That relationship matters for interpretation. Variance is expressed in squared units, which are often uninterpretable on their own. If your data are in dollars, variance is in dollars-squared. Taking the square root returns the result to dollars, which is why SD is the reported measure in most applied work.
Key properties worth knowing:
- SD is always zero or positive; it equals zero only when every value in the set is identical.
- SD is sensitive to outliers. One extreme value can pull the sum of squared deviations sharply upward, inflating the result.
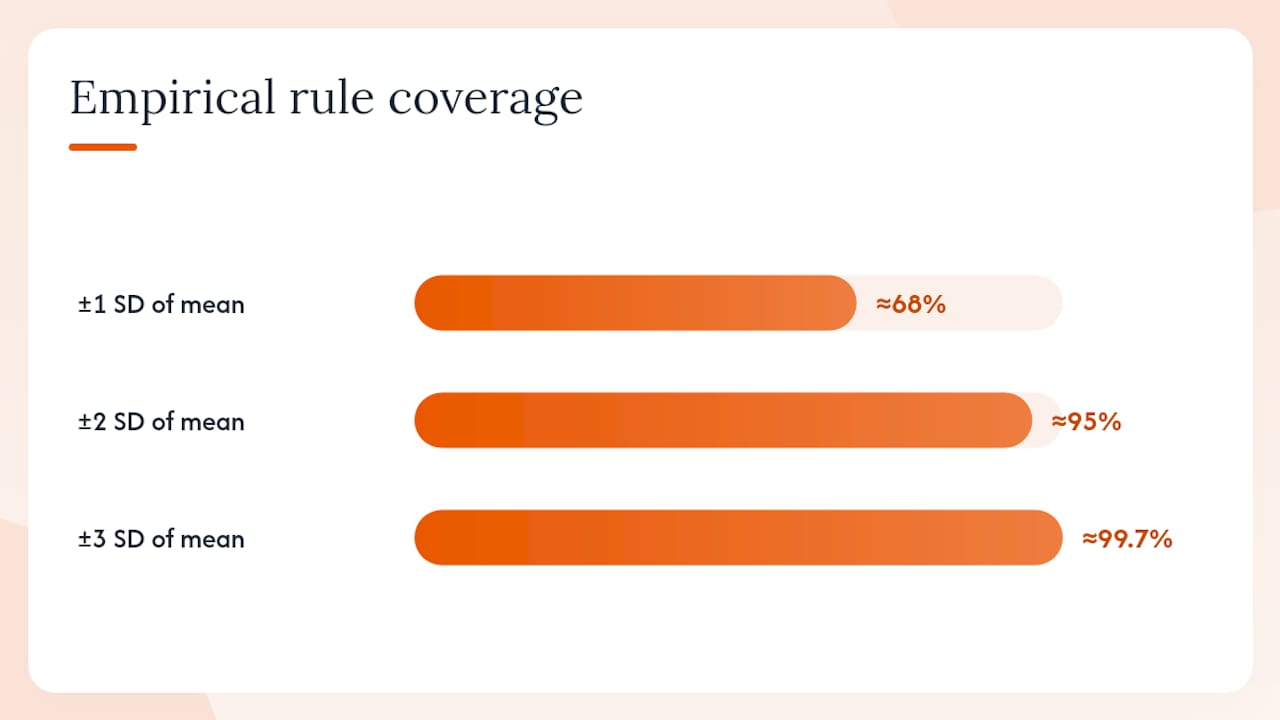
- For roughly bell-shaped (normal) distributions, the empirical rule from Wikipedia's standard deviation entry gives a useful benchmark: approximately 68% of values fall within 1 SD of the mean, 95% within 2 SDs, and 99.7% within 3 SDs.
The 68–95–99.7 rule applies to normal distributions. Skewed data or data with heavy tails can have very different proportions within those same SD bands, so check your distribution before relying on this rule.
The Math Doctors' discussion of alternate SD formulas points out that algebraically equivalent forms exist, some of which are more numerically stable for large data sets. The standard textbook form is fine for hand calculations; software handles the stability issue automatically.
How to verify your SD in Excel, Python, and R
Once you have a hand-calculated result, confirming it with software takes under a minute. The table below lists the exact functions and their defaults.
| Tool | Population SD (divide by N) | Sample SD (divide by n − 1) | Notes |
|---|---|---|---|
| Excel / Google Sheets | =STDEV.P(A1:A8) | =STDEV.S(A1:A8) | STDEV.S is the default STDEV in older Excel |
| Python (numpy) | np.std(data, ddof=0) | np.std(data, ddof=1) | ddof=0 is numpy's default — watch this |
| R | popsd <- sqrt(var(x)*(n-1)/n) | sd(x) | R's sd() uses n − 1 by default |
The ddof argument in numpy stands for "delta degrees of freedom." Setting ddof=0 gives the population formula; ddof=1 gives the sample formula. JMP's statistics knowledge portal documents these defaults and flags that many users call np.std() without specifying ddof, silently getting the population version when they needed the sample version.
For the worked example above, entering the eight values into =STDEV.P() should return approximately 4.72, and =STDEV.S() should return approximately 5.04. If your software result matches your hand calculation, your arithmetic is clean. If it does not, the most likely culprit is a mismatched denominator.
Alternate algebraic forms, such as computing Σx² − (Σx)²/n before dividing, can be faster for large data sets entered into a spreadsheet row by row. The Math Doctors resource covers these forms in detail for anyone building custom spreadsheet templates.
Common mistakes when computing standard deviation
Most SD errors fall into a small number of repeatable patterns.
- Trusting software defaults blindly — As StatPearls on NCBI makes clear, the sample formula with (n − 1) is the standard in most research contexts, but numpy defaults to ddof=0. Always confirm which version a function is using.
Pro Tip: Label every result you report as either σ or s. Unlabeled SD values create ambiguity for anyone who reads your work later, including yourself.
A quick verification workflow: compute by hand, run the matching software function, compare. If the two values agree to two decimal places, you are done. If they differ, check the denominator first, then check whether you used the mean or the population mean in the deviation step.
Key Takeaways
The population formula divides by N; the sample formula divides by (n − 1). Compute variance first, then take the square root to get standard deviation in the original data's units.
| Point | Details |
|---|---|
| Two distinct formulas | Population SD uses N; sample SD uses (n − 1) via Bessel's correction. |
| Variance comes first | Compute the mean of squared deviations, then square-root to reach SD. |
| Software defaults vary | numpy defaults to ddof=0 (population); R's sd() defaults to sample (n − 1). |
| Units and outliers | SD is in the same units as your data and is sensitive to extreme values. |
| Apexapro calculator | Paste your data into Apexapro's free SD calculator to verify population and sample results instantly, with no sign-up needed. |
Why formula-first teaching actually works
Most statistics resources bury the formula three paragraphs in, after a lengthy motivation about "why variability matters." For someone who already knows why they need SD and just needs the formula, that structure wastes time.
Presenting the population and sample formulas at the top of the page serves the majority of real lookup queries: a student mid-homework, a researcher double-checking notation, an analyst confirming a software call. The formula is the answer. Everything else, the notation table, the worked example, the software shortcuts, supports the formula rather than building toward it.
The single worked data set computed both ways is a deliberate choice. Seeing σ ≈ 4.72 and s ≈ 5.04 from identical inputs makes the denominator difference concrete in a way that no amount of algebraic explanation fully achieves. The gap is small with eight values; with three values, it becomes dramatic, which is why Bessel's correction matters most in small samples.
Verify your results instantly with Apexapro's free SD calculator
Crunching through squared deviations by hand is the right way to learn the formula. Verifying the result in under ten seconds is the right way to catch arithmetic slips.

Apexapro's free, browser-based standard deviation calculator handles both population and sample SD in one tool. Paste in your values, select population or sample, and get the mean, sum of squares, variance, and final SD displayed with a step-by-step breakdown. No account, no download, no waiting. The tool runs instantly and is available in both English and Spanish, making it useful whether you are working through a stats assignment or checking a quick calculation at your desk. Head to Apexapro and paste your data to confirm your result right now.
Useful sources
These references cover the formulas, proofs, and worked examples in greater depth for readers who want to go further.
| Source | What it covers |
|---|---|
| LibreTexts statistics resource/04%3A_Measures_of_Variability/4.03%3A_Standard_Deviation) | Population formula, stepwise computation, and open-access textbook context |
| StatPearls / NCBI: Standard Deviation | Sample formula, Bessel's correction, and clinical research applications |
| Penn State STAT 200: Measures of Spread | Notation conventions, variance relationship, and university-level explanation |
| NIH: Finding and Using Health Statistics | Worked numeric example with intermediate steps, health data context |
| JMP Statistics Knowledge Portal | Software function references, defaults, and practical computation notes |
| Scribbr: How to Calculate Standard Deviation | Step-by-step tutorial with clear explanation of why n − 1 corrects bias |
| Wikipedia: Standard Deviation | Empirical rule (68–95–99.7), algebraic forms, and distribution properties |
| The Math Doctors: Formulas for Standard Deviation | Alternate algebraic forms useful for spreadsheet and large-sample computation |
This article provides general educational information about statistical formulas. For research or clinical applications, confirm your methodology with a qualified statistician or consult the primary sources listed above.